
Understanding Market Cycles & Economic Relationships
The Australian share market is putting in a consolidating performance so far in 2017. The share market has a 52 week high of 5,950 and the US Dow Jones recently hit a record high of 21,000.
There is much more anecdotal evidence in Australia as to why the All Ords now has the best chance to rise above 6,000 over the course of 2017 and then head towards and above the previous record market high of 6,828 points in November 2007. In the 142-year history (since 1875) of the Australian share market, after every boom there has been an inevitable bust. Some of these busts, as in 1987, have seen the market decline by up to 50 per cent in a very short time.
The one thing that market history tells us is that after every boom and bust the market has always worked its way back to its previous high and then surpassed it. This has occurred over every cycle except the one we are in now.
In November 2017, it will be 10 years since the all-time market peak was achieved. The inevitable question is, will we reach the previous high of above 6,800 and when? Probably not this year but 6,000 is a real possibility by 2017 calendar year-end and the previous record high being reached and exceeded in late 2018.
Why the share market could be poised to rise in 2017/18 A stellar round of half-yearly company earnings results and increased dividend payments, coupled with a rise in commodity prices over the past 12 months, continues to help lift the share market during the reporting season.
Triggers likely to send the index higher for the remainder of 2017 and into 2018 include the sustainability of company earnings, the potential for increasing dividends for the full year to 30 June 2017, then the subsequent periods to 31 December 2017 and 30 June 2018.
Coupled with commodity prices staying around the current levels, a lower exchange rate and a low cash rate of 1.5 to 2 per cent create almost the ideal conditions for many companies to grow their businesses both organically and strategically.
Where we are:
We are still around 13 per cent below the record market high. Frustratingly after nearly 10 years, it is taking some time to achieve the previous high in this current cycle. Will 2017 and 2018 be the years we finally hit the boom phase?
It often takes five to seven years to get to the boom phase of the cycle. Because of the digital age and the power of the information age, and a revolving door of country leadership on a world scale, the old norms of a cyclical market have been rewritten for the 21st century.
When we get well into the boom phase, between 11 o’clock and 12 o’clock on the Investment Clock (see below) all the usual signals are there to tell investors they are on borrowed time. This is a time of maximum optimism, a feeling of real and sometimes imagined wealth, where investors have accumulated significant assets and have an attitude that favourable conditions will continue indefinitely.
We are not quite there yet at 9 o’clock but could be just about to enter the early stages of the boom phase, which some have predicted could last for 18 months to two years.
We do not actually reach the boom phase on the Investment Clock until we get to 6,000 points on the All Ords and then surpass the record high. Some commentators are of the view that the Investment Clock is just at the beginning of 9 o’clock, as shown by the arrow below – towards the end of the recovery phase and creeping towards the start of the boom phase.
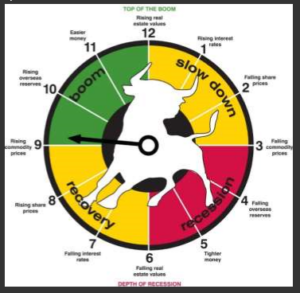
(Please note: The Investment Clock has been around since it was first published in London’s Evening Standard in 1937. While not flawless, the clock can provide a useful, simplistic guide to understand what might lie ahead in the economic cycle. The difficulty is determining exactly where the hand on the clock should be placed at any given time.) Source: Bourse Communications.
Following a string of good company results and a rise in commodity prices, the future is starting to look brighter, but how can we be sure that it really is time to invest our money and how do we know where we are in the investment cycle?
While share brokers and analysts might argue about where we are exactly, when looking at the Investment Clock most will agree that it takes between seven and 11 years for the share market, and the clock, to run full cycle.
Because it would appear that we have passed the recovery phase through 6 o’clock to 8 o’clock, the general consensus is that we should start preparing ourselves for the unpredictability, yet rewards, that can be delivered during of the boom phase.
Of course of you are considering buying shares, seek financial advice and assistance on how you can capitalise on opportunities.
At 9 o’clock the seeds of the recovery are now well and truly sown. With Donald Trump presidency heralding a large rise in the Dow Jones since his election, share prices have started to show the tell-tale boom signs of gradual to rapid increase,
with a rise in commodity prices and overseas reserves being rebuilt.
This entering of the boom phase means we have moved beyond the difficulties of 8 o’clock, where companies were forced to become leaner and increase productivity.
These measures and the slowly improving economy were part of this cyclical process and have translated into increased company profits, which worked, as expected, to gradually stimulate the recovery of share prices.
Please always feel welcome to contact our office if you have any questions about what you have read.